UX Research + Design

Mapping & forecasting urban heat for climate-resilient cities

UX research and dashboard design for “AI for the Resilient City” (Gramener × Evergreen, under a Microsoft AI for Earth grant) — a geospatial analytics tool that lets Canadian municipalities see, compare, and forecast urban heat to plan climate action.

My role
UX Researcher & Designer
Timeline
2020 · Gramener
Org
Gramener × Evergreen · MS AI for Earth
Methods
Interviews · contextual inquiry · usability testing
Tools
Figma · Figma Prototype · InVision · Illustrator · Mapbox · OpenStreetMap
The problem

Canadian cities face the urban heat island (UHI) effect — pockets that run hotter than their surroundings, driving heat illness and energy use. Finding and tracking those hotspots is hard: it needs many datasets stitched together, and the people who must act range from GIS experts to non-technical city officials.

Research question

How might we help municipal stakeholders — across very different levels of expertise — see where heat is worst, understand what drives it, and plan evidence-based climate action?

Outcome

A live geospatial tool, piloted in the City of Calgary, that lets stakeholders analyze and plan climate interventions at a micro (ward / building) level — and forecast UHI to 2030.

6
geospatial data layers unified
3
modes: Story · Compare · Forecast
2030
scenario-forecast horizon
Calgary
pilot city · scalable nationally

What was at stake

Evergreen, a Canadian non-profit building low-carbon, inclusive cities, partnered with Gramener — a design-led data-science firm — under a Microsoft AI for Earth grant to build “AI for the Resilient City.” The tool fuses geospatial analytics, AI, and big data into a single source of truth so municipalities can pinpoint problem areas and act.

The hard part wasn’t the data — it was making heat legible and actionable for a mixed audience. As the UX researcher and designer, my job was to bridge climate scientists, data engineers, and city officials, and turn complex spatial data into dashboards people could actually decide from.

Research judgment

How I approached it

Method I chose

Mixed methods grounded in the field — stakeholder interviews and contextual inquiry, SME consultation with climate scientists, comparative analysis of existing geospatial / climate dashboards, MoSCoW prioritization against data feasibility, and iterative usability testing.

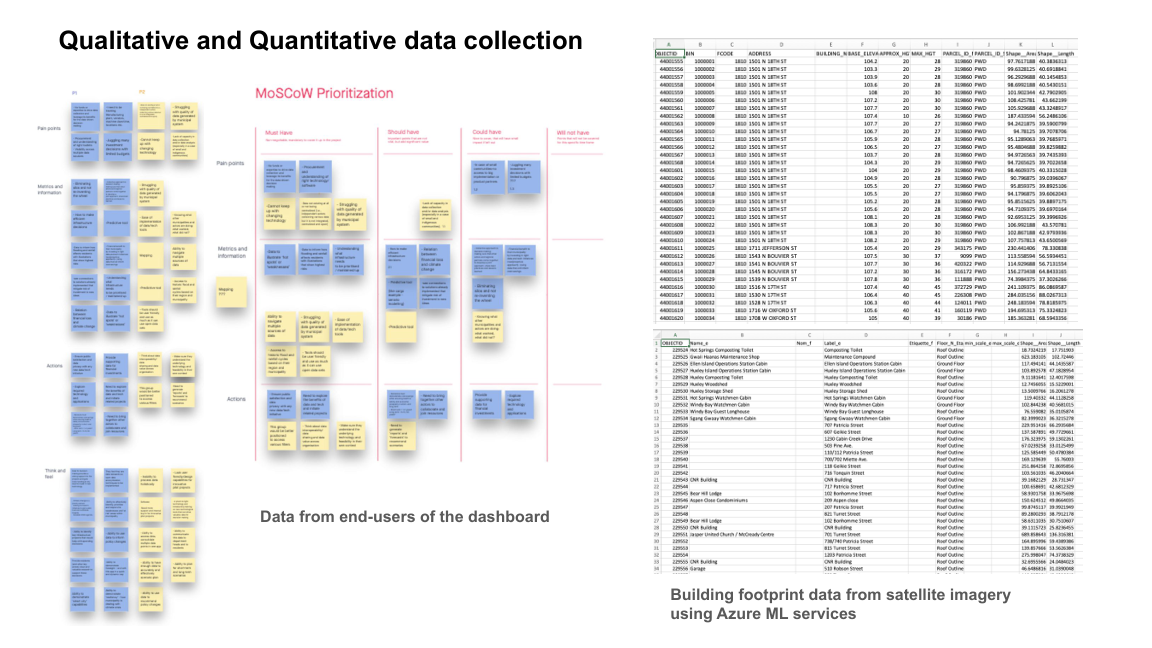
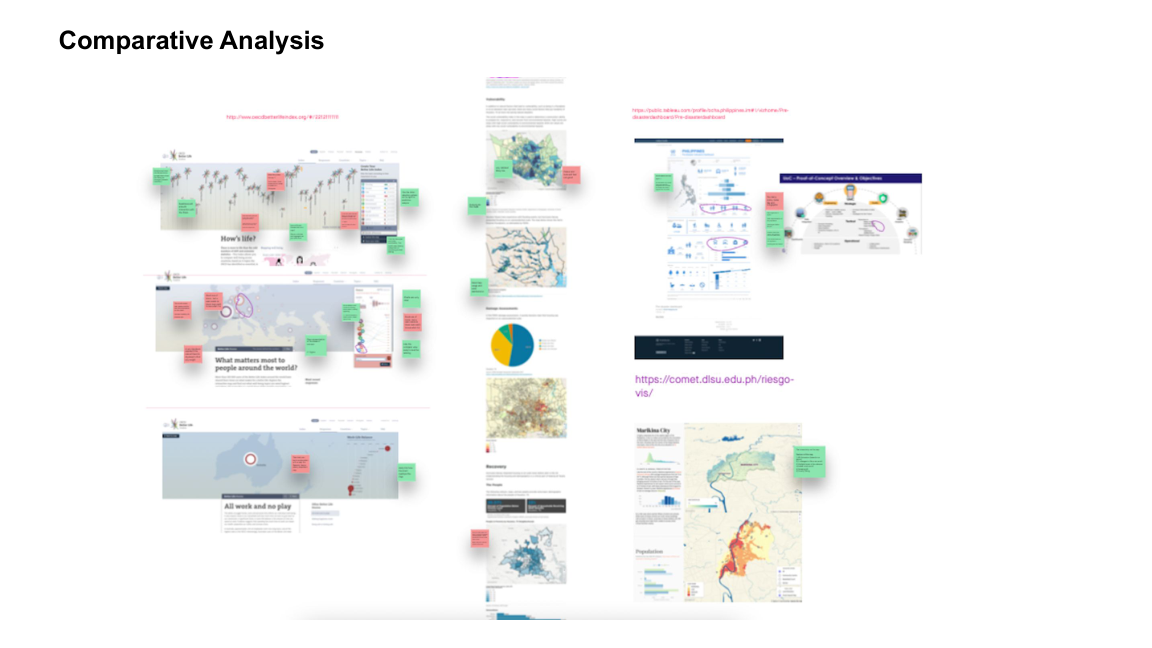
Geospatial + climate data is technical, and the audience spans GIS professionals to casual municipal users. Interviews and contextual inquiry surfaced how each user actually reasons about heat and risk; SME consultation kept the science correct; comparative analysis set the design bar; usability testing made the dashboards intuitive.

Constraints I balanced: Data feasibility was a hard limit — not every desired variable was reliably available. I ran workshops to balance user needs against what the data could support, and used MoSCoW to keep scope honest.

Alternatives I considered
Build dashboards straight from data / engineering specs
Why not: Would yield technically-correct views that non-expert officials couldn’t act on — the whole point was decisions across expertise levels.
One dashboard for everyone
Why not: A single view can’t serve GIS pros and casual users; research pushed toward layered modes — Story for overview, Compare for analysts, Forecast for planners.
Survey-only research
Why not: Couldn’t capture how domain experts reason spatially; contextual inquiry in their workflow was essential.
Research → design

Research & synthesis

Before designing a single screen, I grounded the work in users and evidence. (Click any image to open it full size.)

Qual + quant inputs: affinity mapping of pain points, metrics, and actions; MoSCoW prioritization against data feasibility; and building-footprint data derived from satellite imagery via Azure ML.
Qual + quant inputs: affinity mapping of pain points, metrics, and actions; MoSCoW prioritization against data feasibility; and building-footprint data derived from satellite imagery via Azure ML. ↗ open full size
Comparative analysis of existing geospatial and climate dashboards to set the design bar.
Comparative analysis of existing geospatial and climate dashboards to set the design bar. ↗ open full size
What we learned

What the research changed

01
People saw the heat but not its causes
Evidence: In testing, stakeholders could read the UHI layer but couldn’t correlate it with vegetation, building type, or population — so I added linked, comparable layers, treating UHI as the dependent variable against vegetation / building / population.
02
Users wanted cause-and-effect, not a snapshot
Evidence: They asked how multiple variables interact to drive UHI — which led to the Compare tool (two KPIs over the same time period) and a multi-variable view.
03
Experts plan against the future, not the present
Evidence: Climate SMEs noted that independent variables (vegetation, building density) can be forecast from current trends — which became the Forecasting + scenario-modeling tool projecting UHI to 2030, with preset scenarios and manual variable / area controls.
04
Non-experts needed an on-ramp
Evidence: For less-technical officials, Story Mode answers broad questions — Is the city getting warmer? Which wards drive it? — by stitching key KPIs (UHI, population, dwellings, ward temperature) into a guided narrative.
What shipped

The tool that shipped

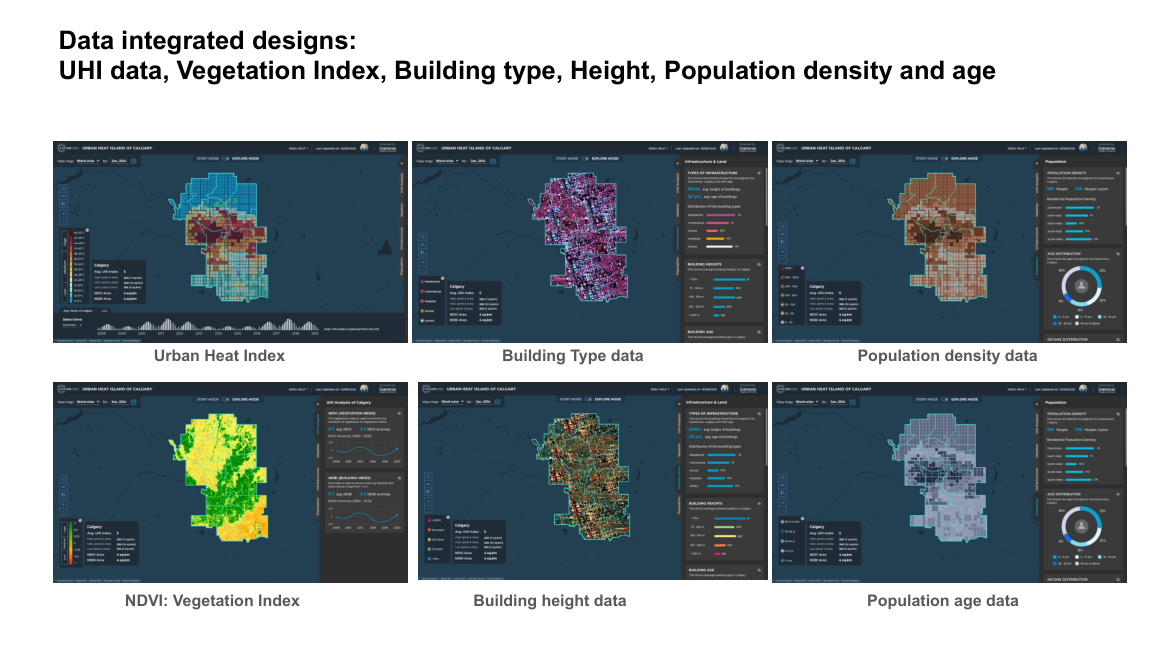
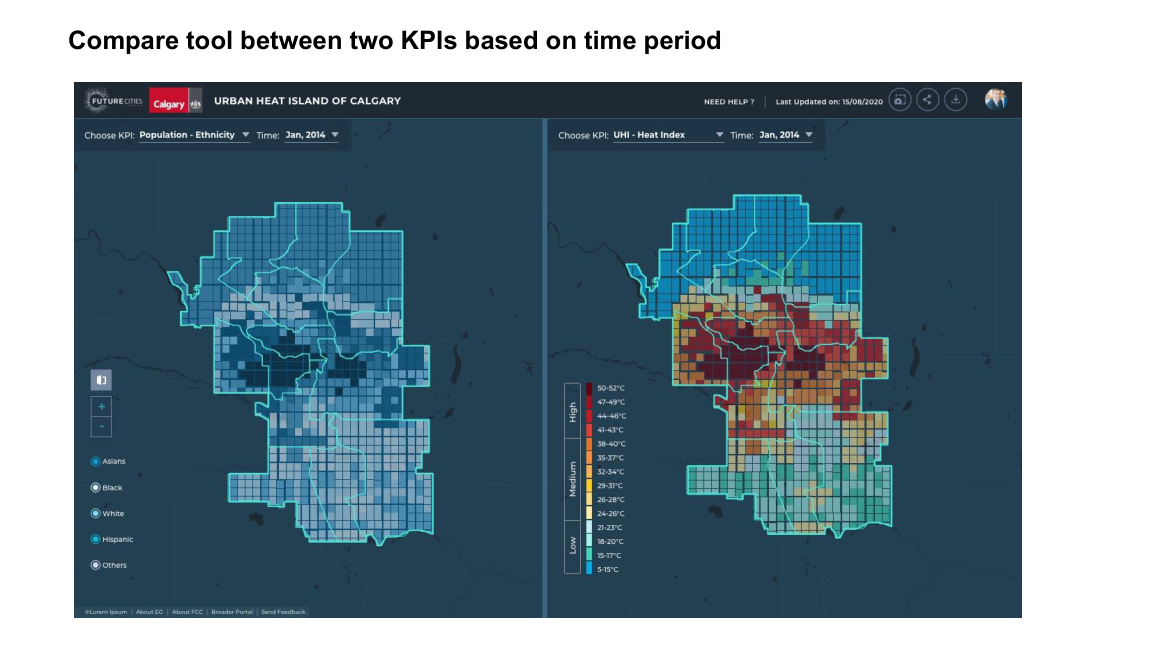
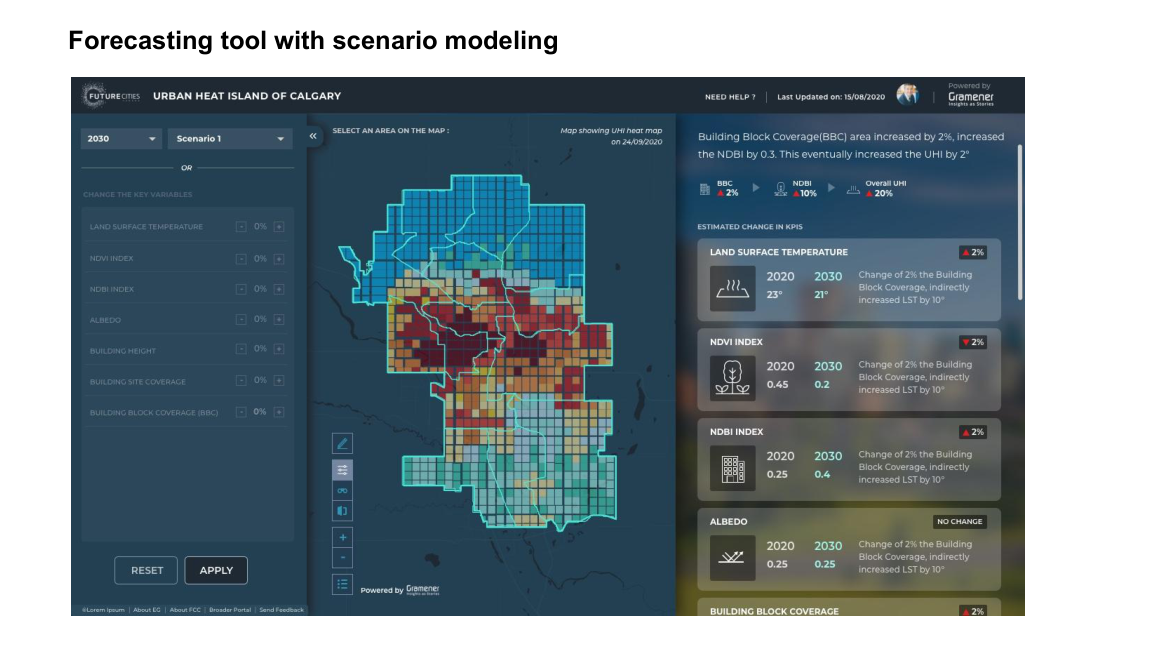
All dashboard interfaces and data visualizations were designed by me in Figma and Illustrator, and prototyped in Figma and InVision. The tool ships three modes — a guided Story Mode, an explore / Compare view, and a Forecast view. (Click any image to open it full size.)

Watch

The dashboard in action — Story Mode for non-experts

Video prototype: Story Mode walks non-expert stakeholders through the city’s heat picture as a guided narrative — answering broad questions before they dive into the explore and forecast modes.

Explore Mode for Experts

For GIS analysts and city planners, the explore views expose the underlying data layers, side-by-side comparisons, and scenario forecasts.

Data-integrated dashboard views for the City of Calgary: UHI, NDVI vegetation index, building type & height, and population density & age.
Data-integrated dashboard views for the City of Calgary: UHI, NDVI vegetation index, building type & height, and population density & age. ↗ open full size
Compare tool: two KPIs side by side over the same time period (e.g., population vs. UHI heat index) to expose relationships.
Compare tool: two KPIs side by side over the same time period (e.g., population vs. UHI heat index) to expose relationships. ↗ open full size
Forecasting tool with scenario modeling: project UHI to 2030 by adjusting variables (NDVI, NDBI, building coverage) or selecting preset scenarios, and pick areas on the map.
Forecasting tool with scenario modeling: project UHI to 2030 by adjusting variables (NDVI, NDBI, building coverage) or selecting preset scenarios, and pick areas on the map. ↗ open full size
Impact over activity

Outcome & impact

  • Piloted in the City of Calgary — municipal stakeholders can analyze and plan climate interventions and corrective action at a micro (ward / building) level.
  • Turned a static heat map into a decision tool: Compare (two KPIs over time), Forecast (scenario modeling to 2030), and Story Mode for non-experts.
  • Integrated NASA LandSat imagery, Microsoft Building Footprints, and infrastructure data on the Azure stack into a single source of truth.
  • Scalable by design — built to roll out across other Canadian cities.
  • Delivered with Evergreen under a Microsoft AI for Earth grant.
If I did it again

Reflection & self-critique

Engage the full stakeholder range from day one. The tool served everyone from GIS pros to casual municipal users — I’d map that expertise spectrum at kickoff, not midway.

Build continuous feedback loops. Integrating user feedback at every stage kept the design aligned with real needs; I’d formalize that cadence even earlier.

Win engineers with evidence. When developers pushed back on new visualizations, user-engagement metrics, drop-off rates, and usability results were what moved decisions — data-driven justification over opinion.

Balance ambition with data feasibility. Workshops to iterate use-cases against what the data could actually support kept the roadmap real.

Live project — read Gramener’s public write-up: AI for the Resilient City.