From the project
The narrative visualization

A narrative data visualization that turned five tangled economic datasets into one interactive story about market sensitivity — recognized at IEEE EuroVis and IndiaHCI.
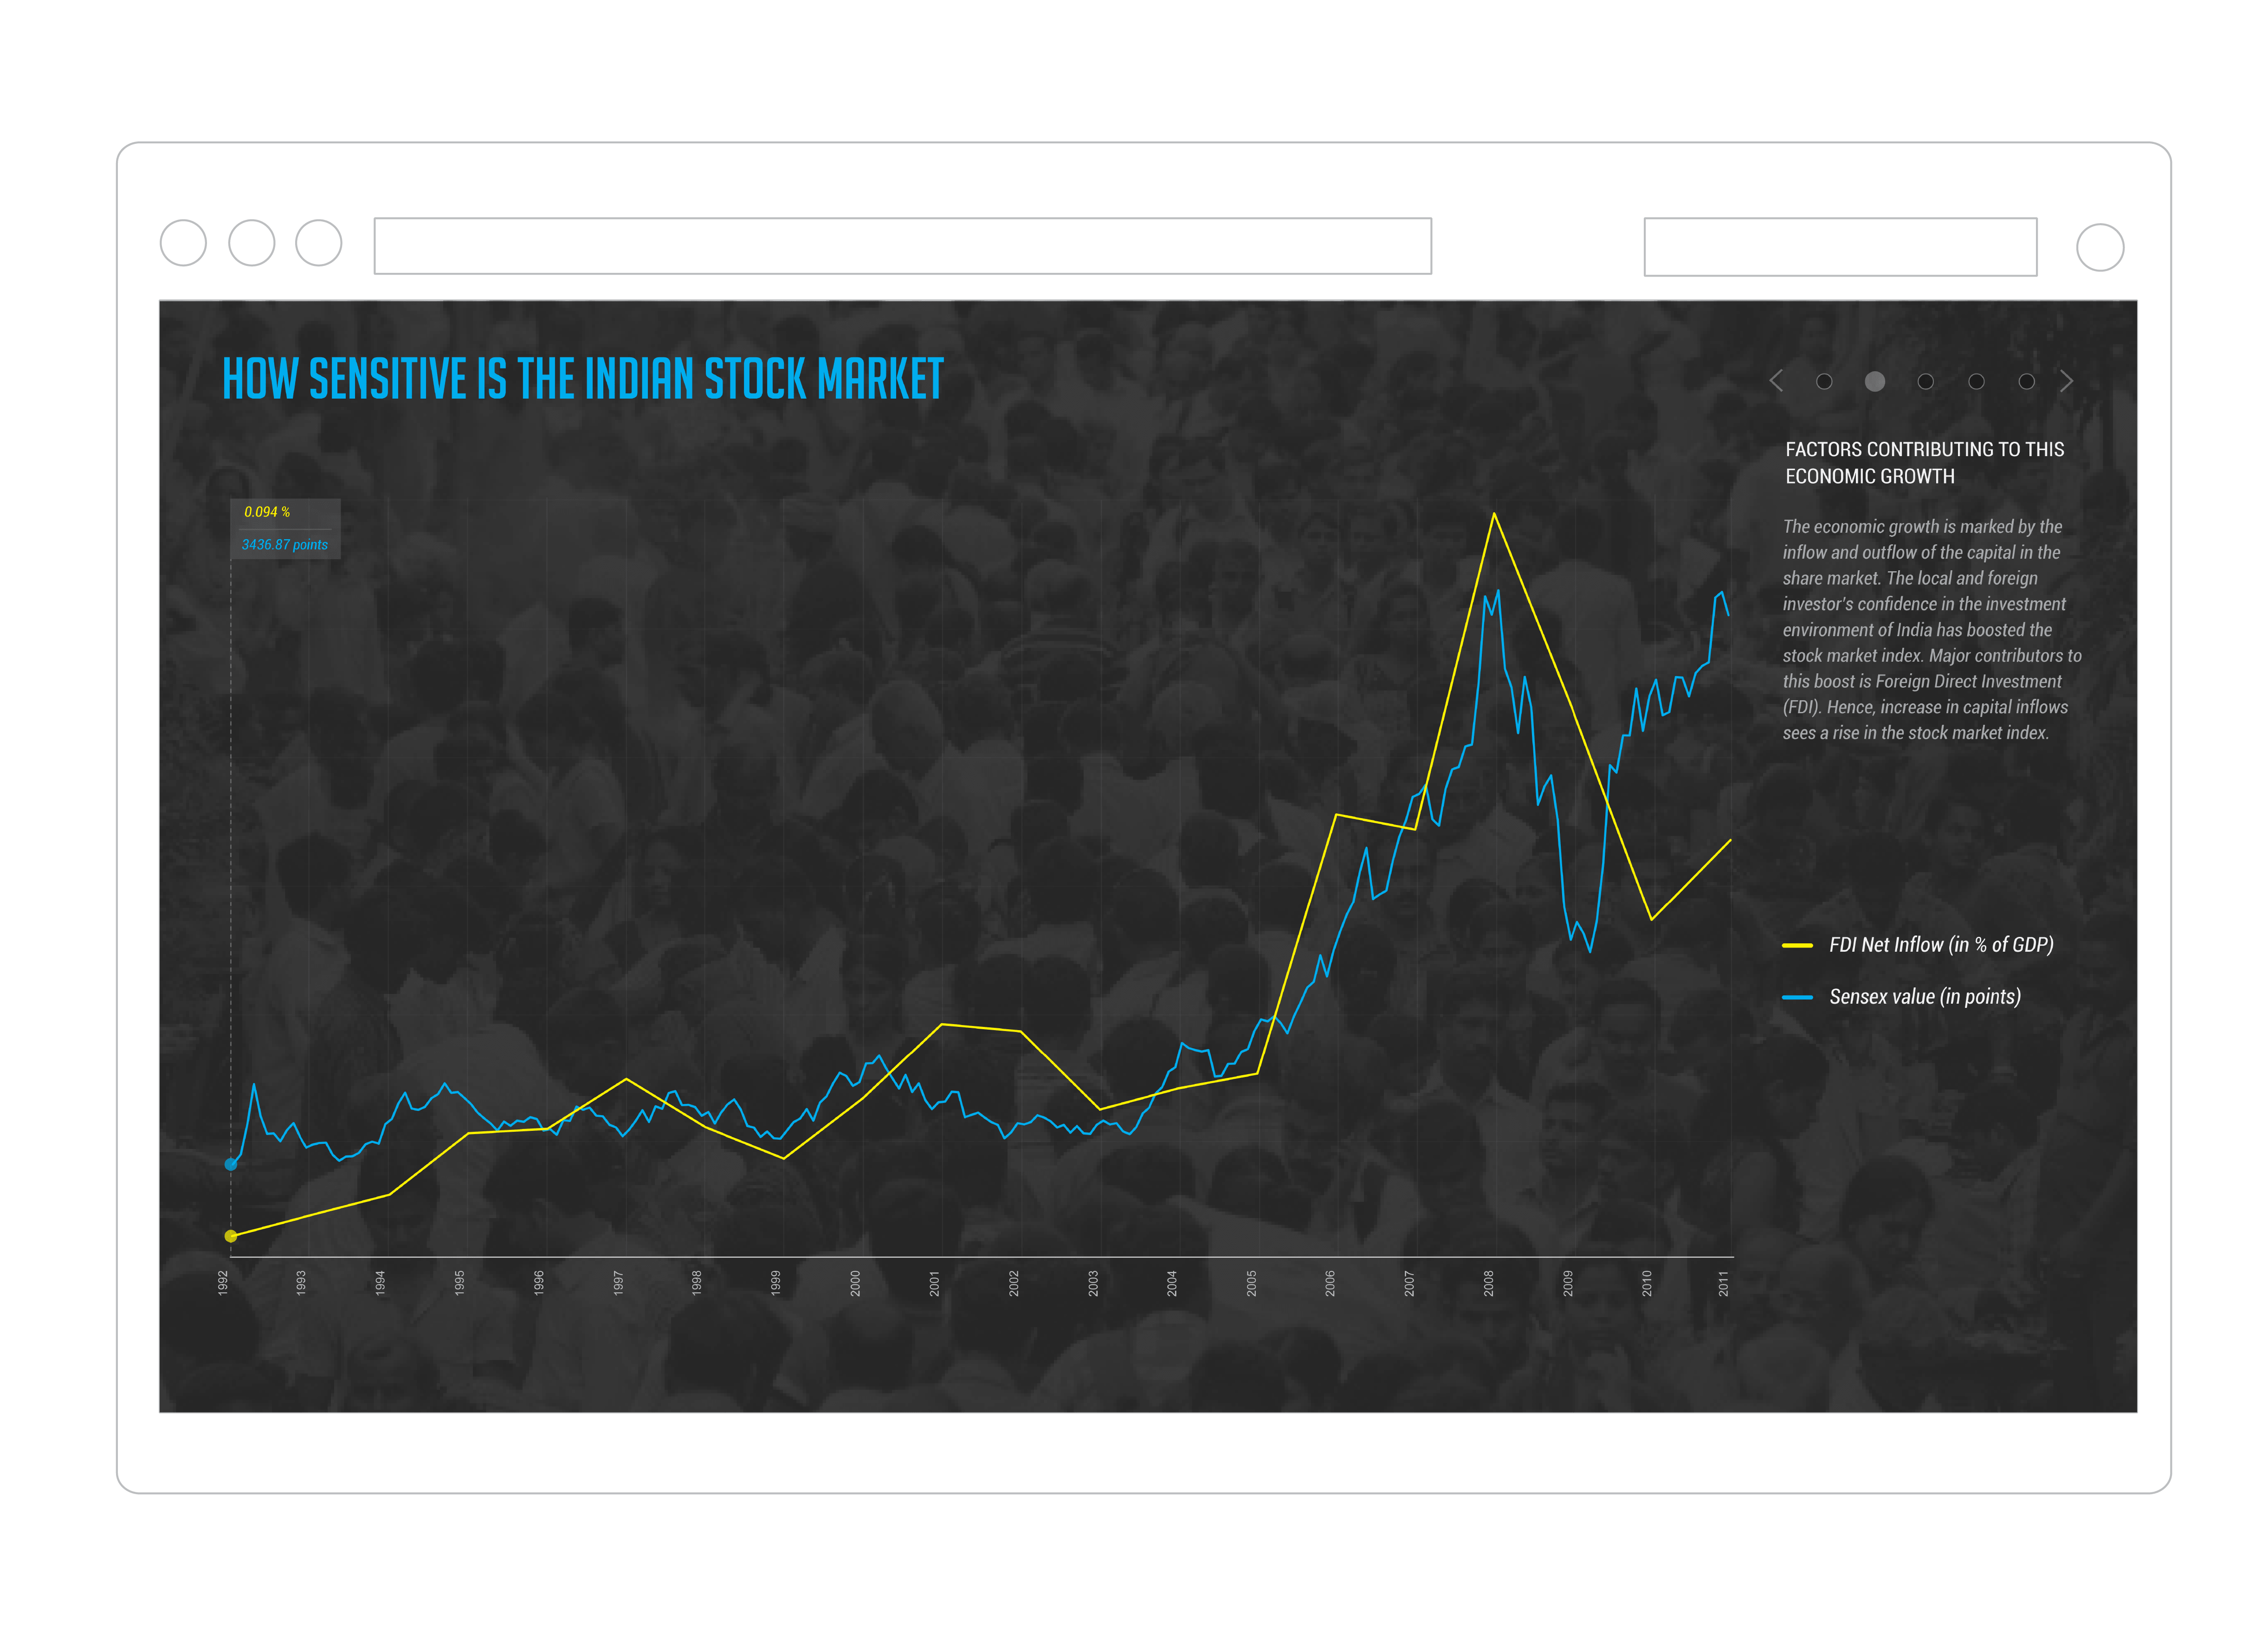
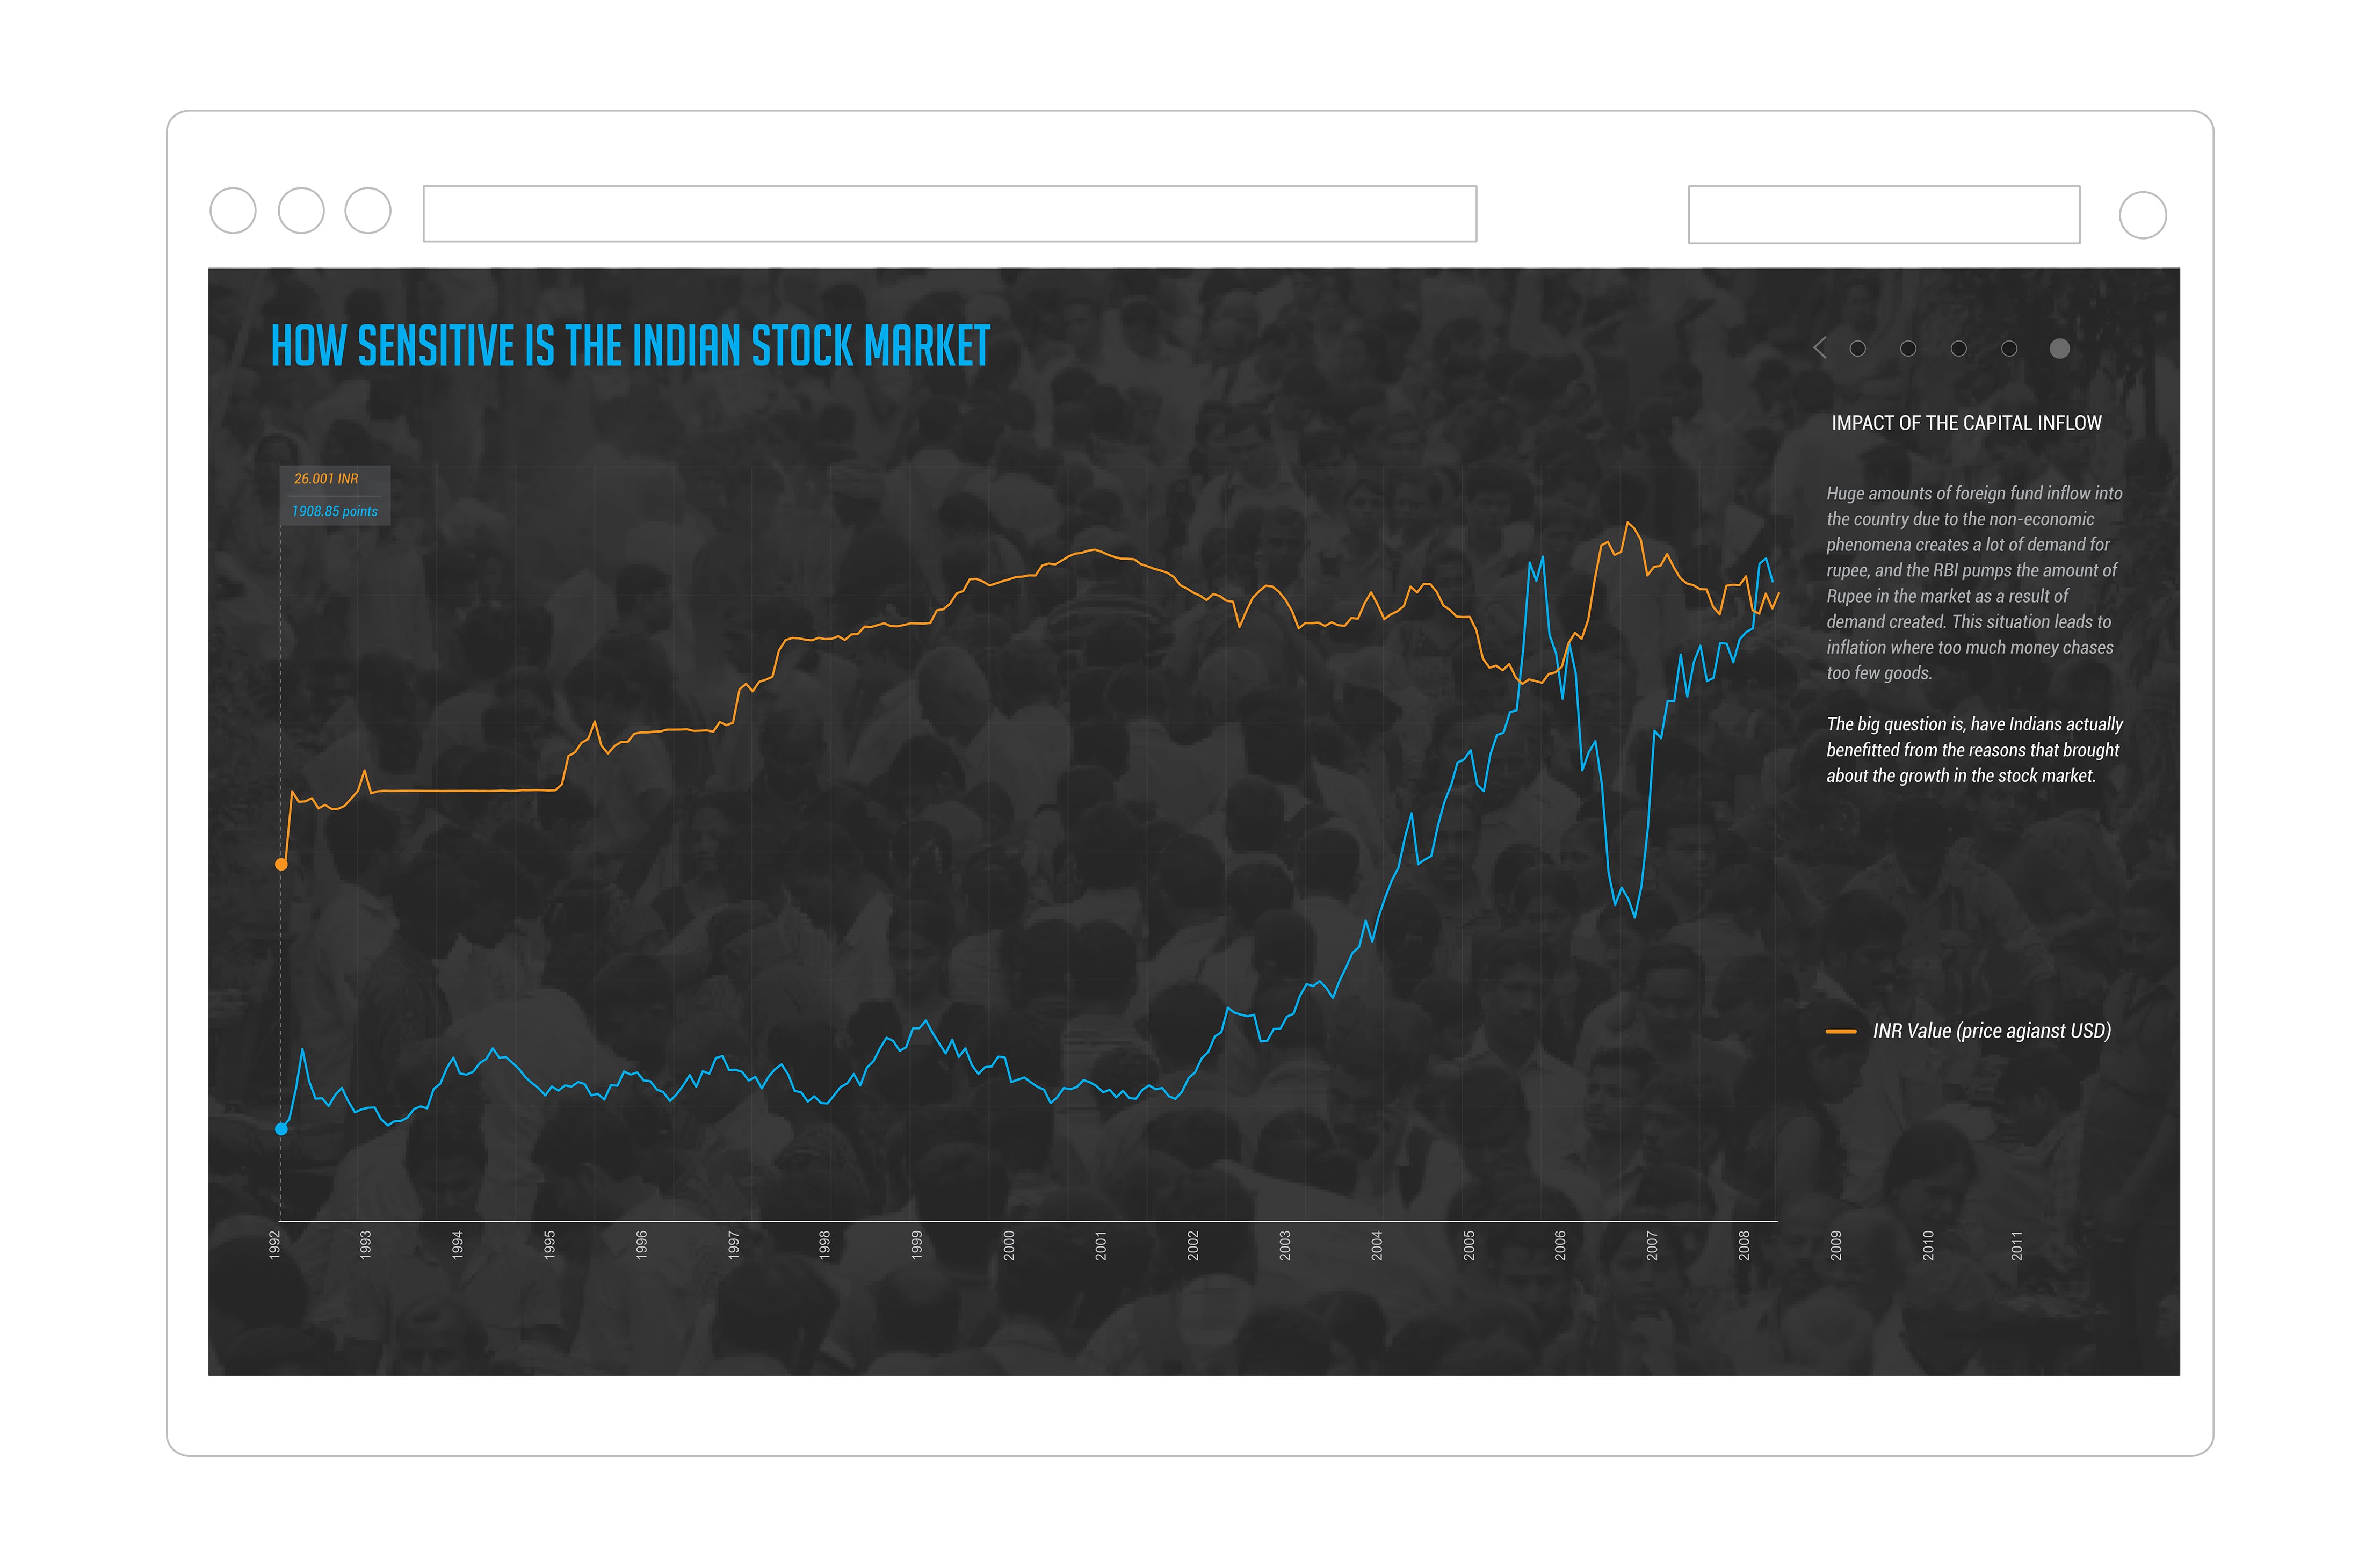
Complex, multi-decade economic data (Sensex, GDP, FDI, rupee value, events) is near-impossible for a general audience to read — so the story it tells about market sensitivity stays locked away.
How sensitive is the Indian stock market to economic and non-economic events, and how can that be communicated so a non-expert can follow and remember it?
An explanatory, interactive narrative that reduces cognitive load through staged storytelling — earned an honorable mention at IEEE EuroVis.
Sparked by P. Sainath's reporting on rural India, I hypothesized a relationship between national events and the country's economic index. The data existed across five sources; the challenge was making it legible and memorable, not just plotting it.
I mined and cleaned two decades of data in R and Excel, built the charts, then layered annotation, color, and a narrative arc in Illustrator and After Effects — researching news for specific dates to explain each rise and fall.
A pure free-explore tool would overwhelm; a pure linear story would bore and hide nuance. The hybrid keeps a guiding arc (martini-glass style) while letting users branch into points that interest them — balancing focus and agency.
Constraints I balanced: Four weeks, solo, and a topic most people find intimidating — so I optimized ruthlessly for comprehension over completeness, showing only events that fit the pattern and saying so.
What I'd change: I'd define success metrics for the story (engagement, recall, decision confidence) and test against them, rather than evaluating craft subjectively.
What I'd keep: The author-driven + reader-driven hybrid. It's the structural choice that made a hard topic both guided and explorable.
What I learned: In data storytelling, editing is the work — what you leave out is what makes the rest legible.